
How to run a T-Test
AddMaple performs a 2-sided T-Test automatically when you pivot by a numeric column and a categorical column with only 2 categories. If you want to run a T-Test on a column with more than 2 categories, you first need to filter down to only look at 2 categories.
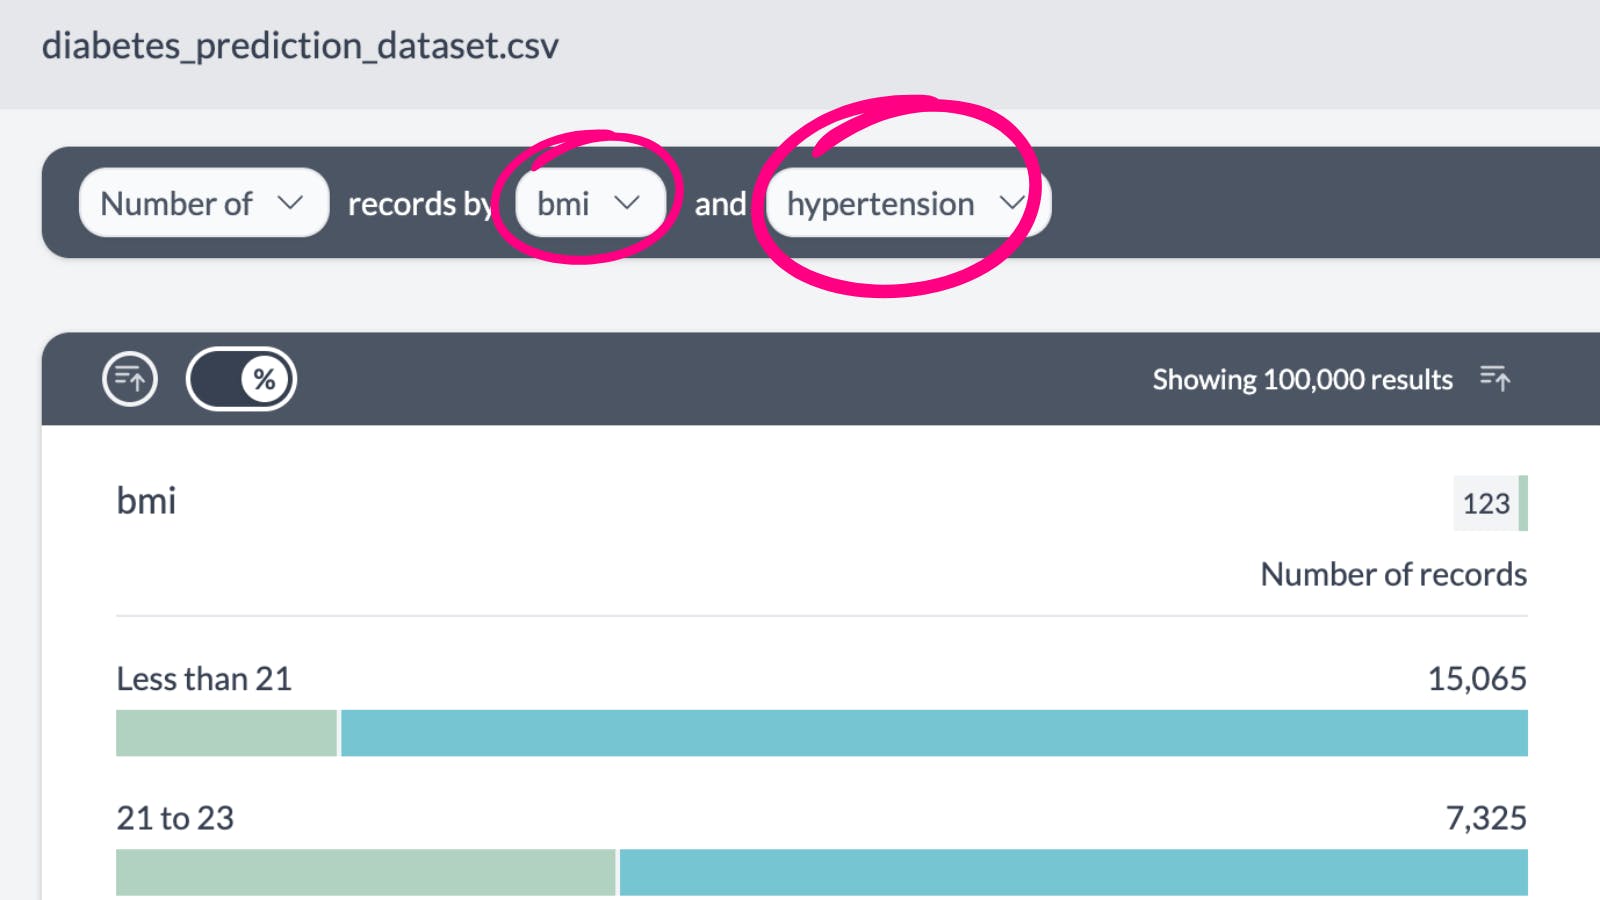
To get started, pivot by the 2 columns. For example in this diabetes prediction dataset we've pivoted by hypertension (category: 1 or 0) and BMI (numeric)
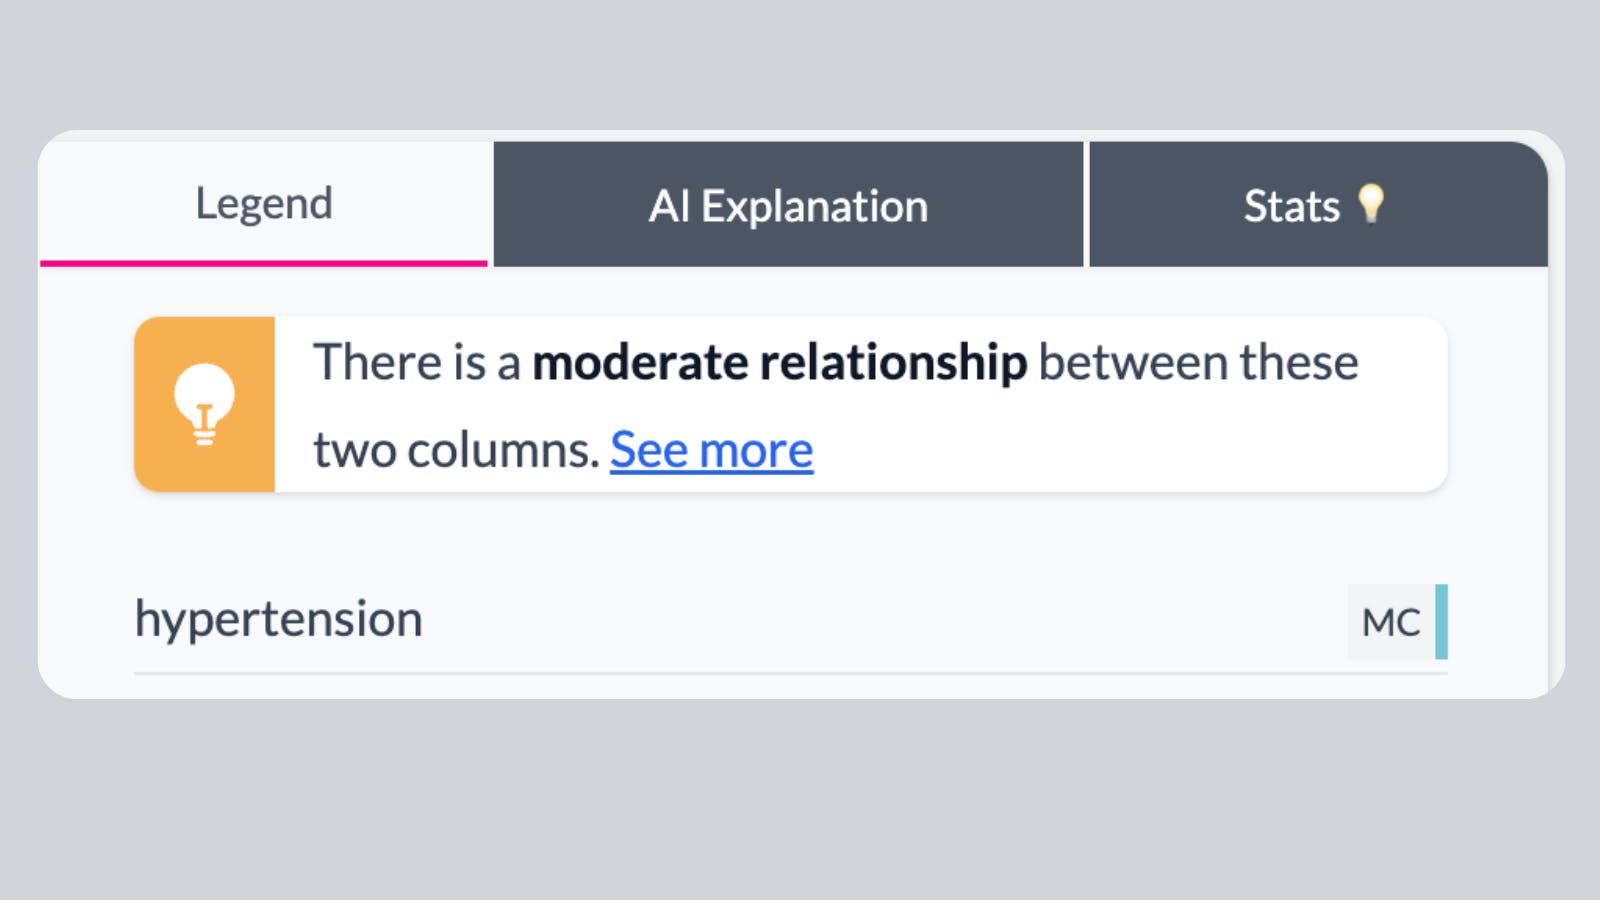
The summary of the t-test will be shown in the legend. To see the numbers behind the t-test click on the "See More" link. This will take you to the stats column where we have more details.
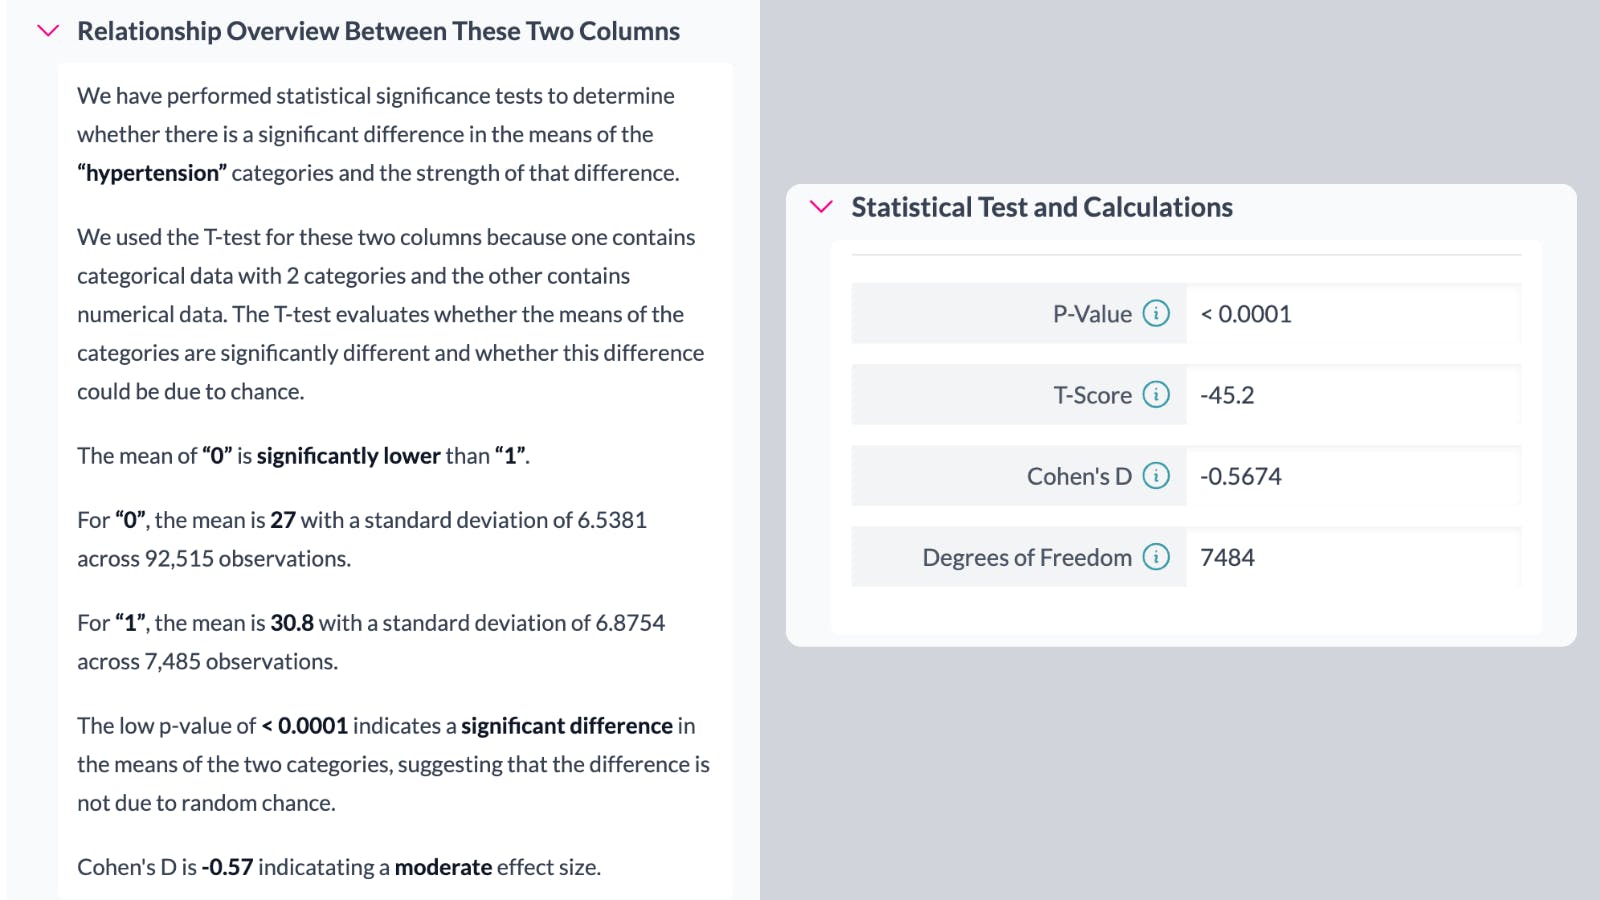
The narrative explains the results of the T-Test. In this particular example there is a significant relationship between Hypertension and BMI with a moderate effect size. The numeric results of the test are below the text summary.

Other Articles