"AddMaple's AI-assisted coding is unique, giving me the control I want when tagging survey comments as opposed to simply a narrative output. Their recently released stats features are helping me get a first look into potential relationships between variables and serve as a nice jumping off point to dig in further."
Stuck in manual mode?
Try formula-free data analysis!
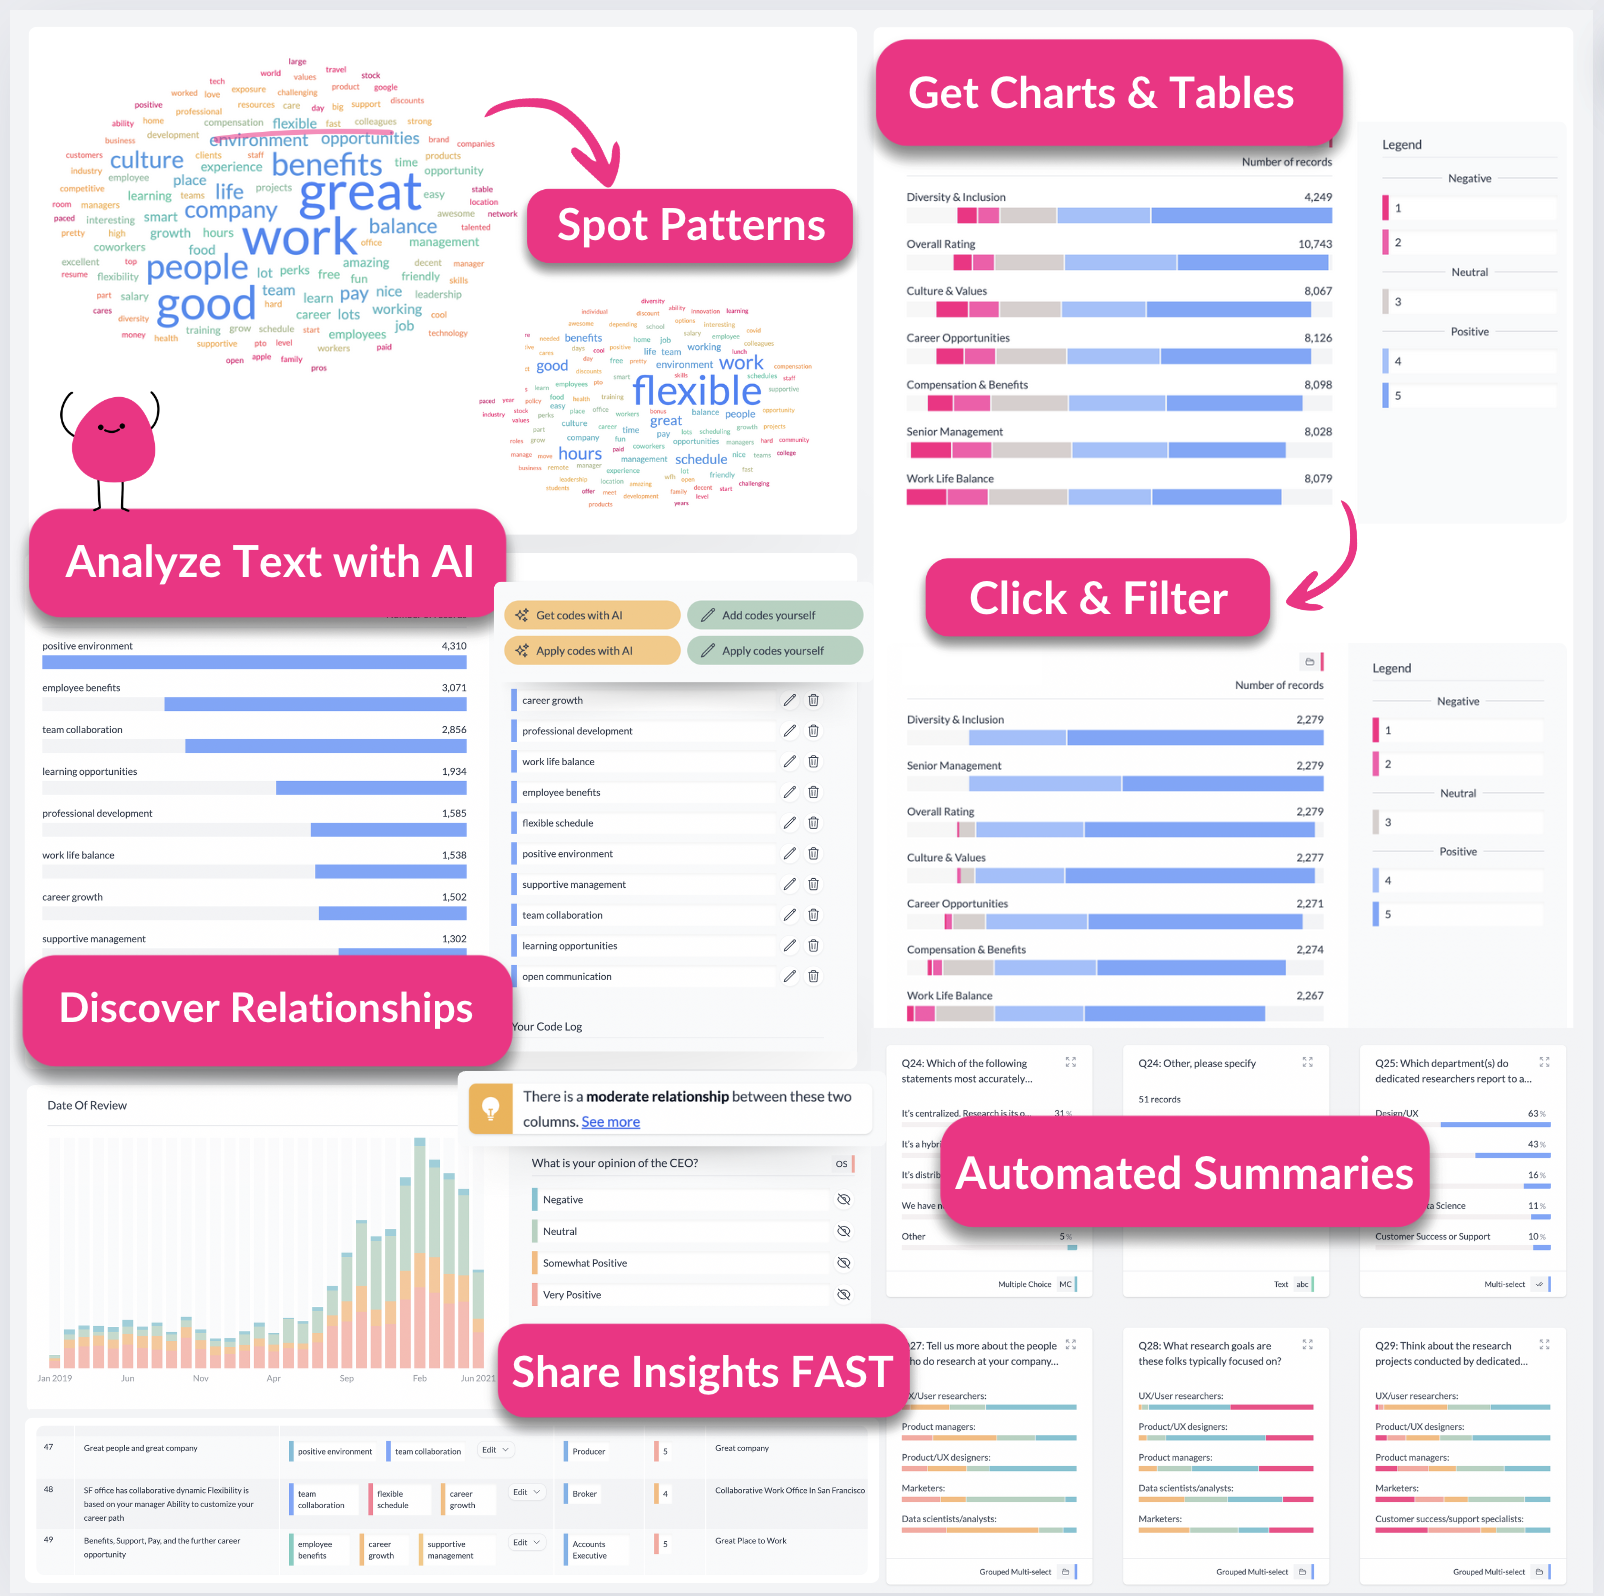
- ★Begin with an explorable dashboard
- ★Analyze text with AI
- ★Discover statistical relationships
★ Perfect for Beginners and Pros
★ No cloud uploads
★ Transparent Pricing
We made a quirky music video to explain why we're different
A few of the 20,000+ people cruising from data exports to reports


No matter your data, get to the "Aha" faster
Leapfrog from raw survey data to summarized dashboards that highlight significant statistical relationships in minutes not months 🐸
- Analyze any survey export: Complex or simple, periodic or one-off, SAV, CSV or Excel file, we've got you covered.
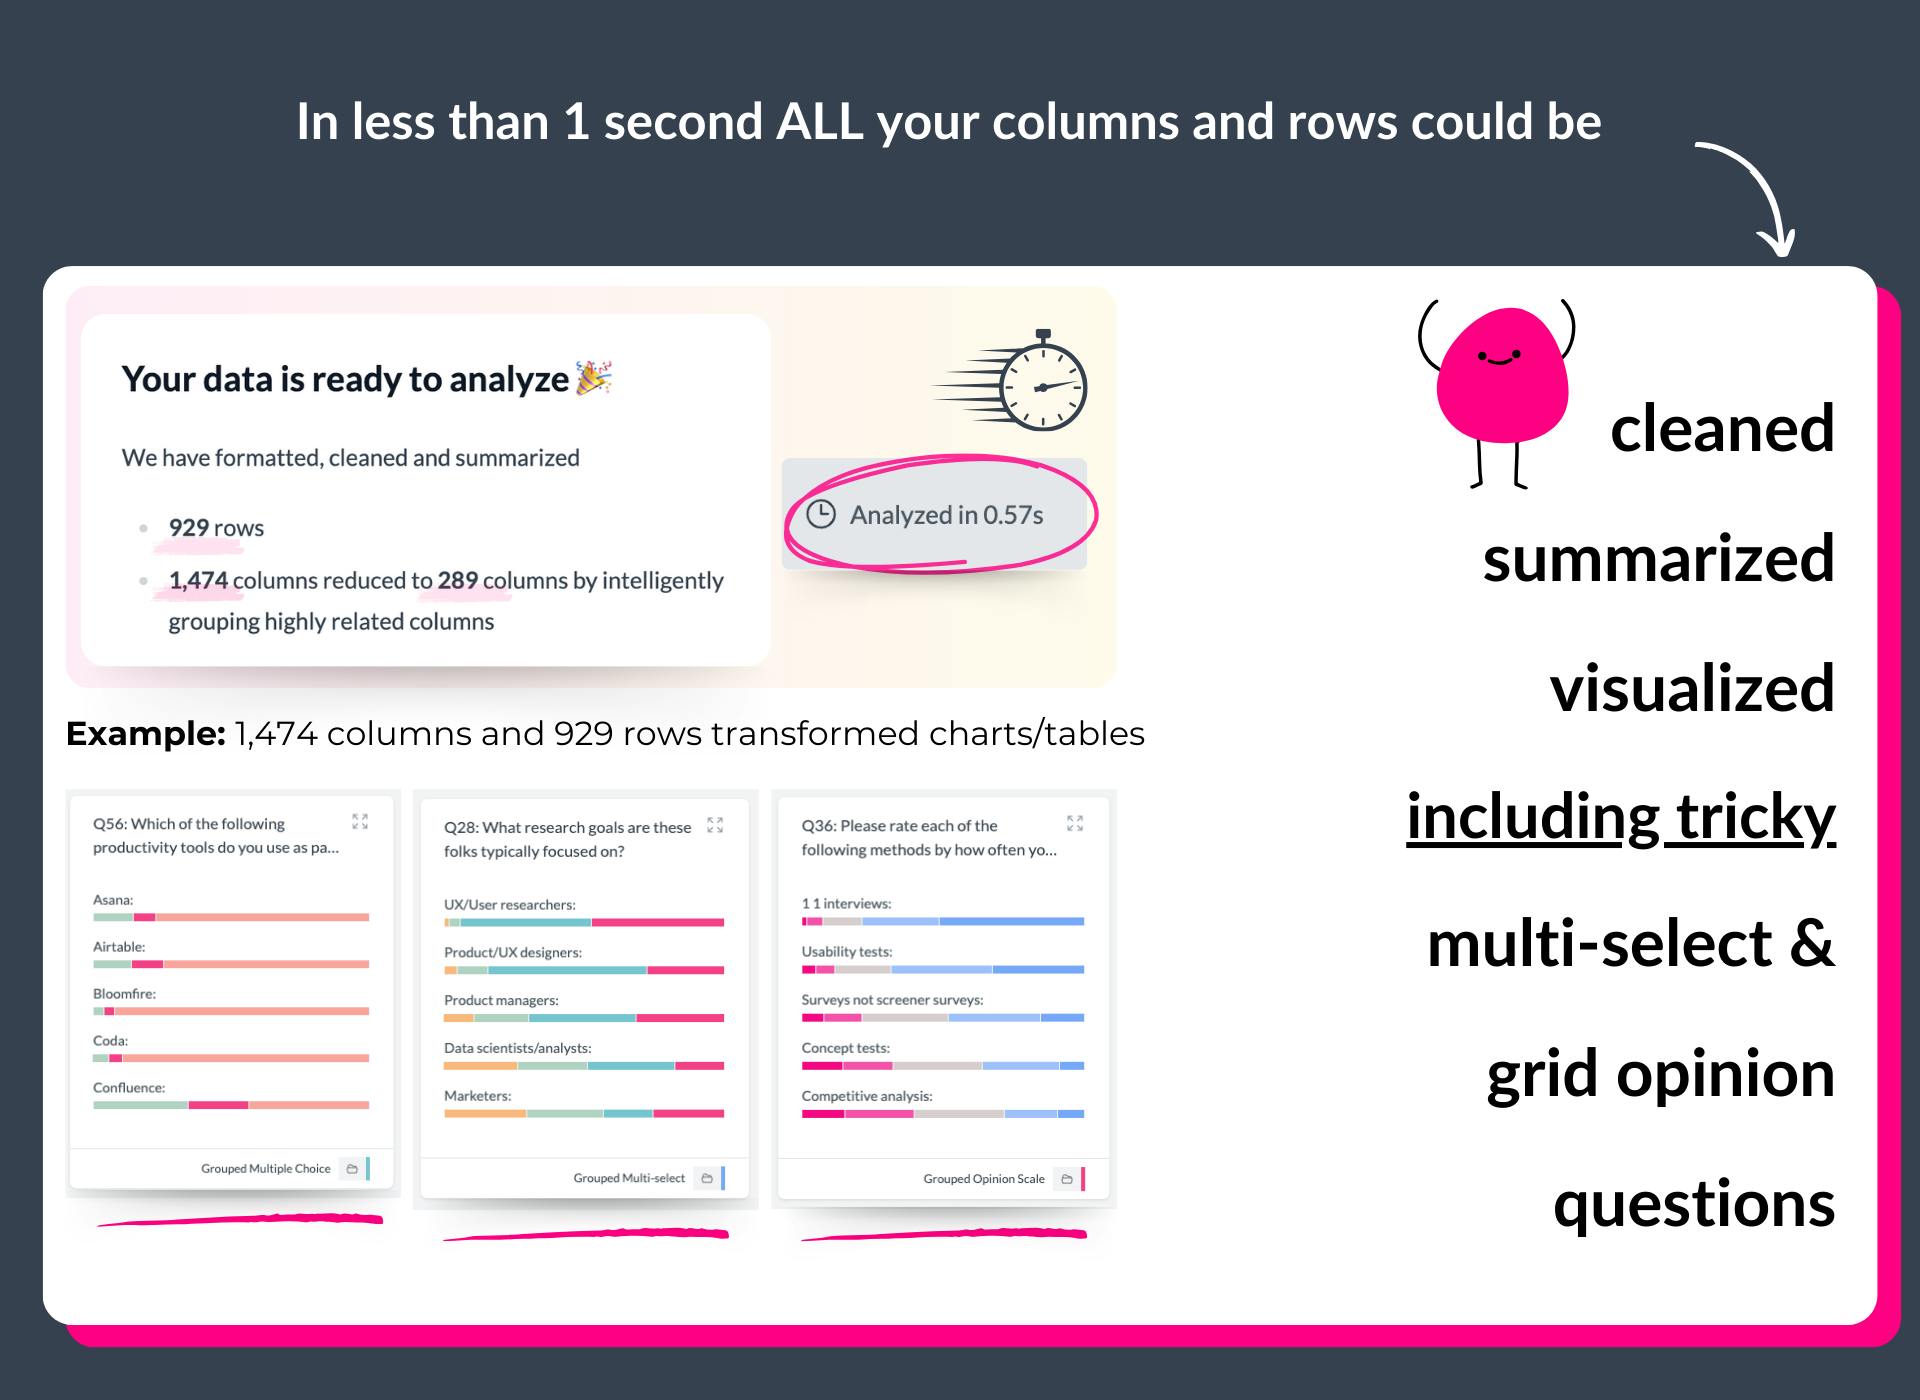
- No manual prep or cleanup: Forget painful data wrangling. We handle missing data and summarize diverse data types: multi-select, dates, numbers, percentages, currencies, matrix/grid, rating, opinion questions and more so you can skip to insights.
- Intelligent grouping for comprehensive analysis: Matrix and grid questions are visualized as holistic Likert scales or stacked charts - automatically.
- Free text analysis: Use Gen AI to help you code and organize open-ended responses into meaningful topics, themes, sentiment, intent or categories.
- Sophisticated statistical tests, segmentation, cross-tabulation, weighting and pivots: Get automated significance testing across all columns. Segment by demographics, question response combinations, free text themes - any value! Pivot two or more columns with a click!

“I've been using AddMaple since this June to help the ReOps community analyze a survey to improve the experience of members. AddMaple has been a game changer to help my team members read insights quickly and democratize survey analysis without the hassle of using R to code. Thank you again for creating such a wonderful tool.”


“AddMaple came at a great time when I was gearing up to spend hours in spreadsheets and pivot tables. AddMaple simplifies my survey analysis process by giving me easy ways to analyze and pivot my responses. When I'm looking for interesting insights and cuts in the data, the first place I check for initial leads is AddMaple.”

"AddMaple's AI-assisted coding is unique, giving me the control I want when tagging survey comments as opposed to simply a narrative output. Their recently released stats features are helping me get a first look into potential relationships between variables and serve as a nice jumping off point to dig in further."

“I was so glad when I found AddMaple, because it allowed me to quickly and easily explore data as part of finishing my PhD. I found it so much more intuitive and user friendly than the statistics program I was using (SPSS).”

“I thought your website was great and easy to use. I liked the AI explanation option a lot too it made the data easier to understand. Also being able to add pivots and analyse the data visually allowed me to find figures quickly. I would have bought AddMaple sooner if I knew about it and it was very helpful with my studies.”

"The most striking thing about working with AddMaple is that it just makes it easy to get going working with all kinds of data. It makes the basics dead simple, and lets you get on with the more in-depth, more interesting things. I found it easy to see the breadth, depth, and shape of the data. I've used it for surveys and analytics data too."

"I am so lucky I found AddMaple. It was incredibly easy to use, and I say that as someone who is usually hopeless with this stuff. Using AddMaple really helped to relieve some of my stress with the project and I was able to complete it in time. I would definitely recommend it to anyone, but especially students."

Features to keep you in flow
AddMaple automates data structuring and cleansing because it:
- handles empty cells grouping them off, bypassing the need for placeholder values
- identifies and summarizes diverse data types: numbers, currencies, dates, text, survey questions, duration, multiple choice, multi-select, matrix, opinions, grid questions and more
- recognizes data patterns: multi-select tags, word and phrase clusters within text responses, numeric data distribution and more
- buckets numeric data into appropriate bins based on their range and distribution, while identifying and restricting the impact of outliers
- summarizes double header or matrix columns for comprehensive analysis automatically
- sorts numeric data containing text descriptions, e.g. age categories containing words such as between, younger than, less than, older than etc.
- supports CSV, Excel & SAV (SAV labels and meta data pulled in automatically)

Watch a demo
"AddMaple creates instant chart dashboards that let you analyze your survey data visually and is one of the best ways I’ve found to conduct AI-powered thematic analysis of open-ended results."
Andrea Knight Dolan from Informed Insights
UX Research + AI Consultant, Ex-Google
Live demo of AddMaple from Informed Insights
Secure by design
Your data stays on your system, with all analysis happening instantly in your browser, not in the cloud.
We support cloud based chart and report sharing - but this is optional and fully within your control. Read more about our approach to security and privacy here.
The fastest data analysis tool out there
Built from the ground-up to be super speedy. No more loading spinners, crashing spreadsheets or scrambled sorting.
Don't believe us? Try this Afrobarometer dataset with over 20 million data points fully loaded and summarized in 2.84 seconds
Get Started


Drop or select your file for instant insights
Don't have a data file to hand?
Try an or book a demo


